Data Portfolios

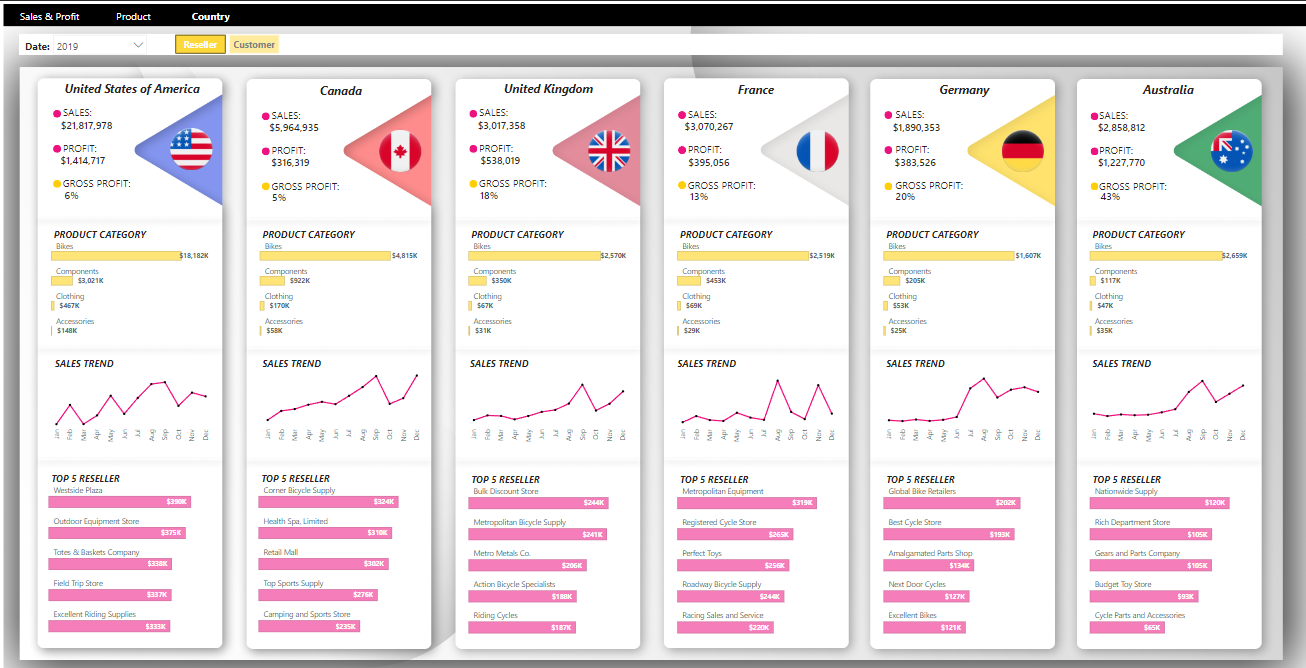
MavenTech Sales Analysis


In this project, we want to analyze the CRM Sales data from MavenTech last quarter performance. The previous quarter presented valuable opportunities to evaluate our performance and refine our strategies. Through a detailed analysis of key metrics, we uncovered actionable insights that reflect both successes and areas for improvement.

This report delves into these findings, highlighting the trends that shaped our performance, the challenges we faced, and the strategic adjustments that can drive sustained growth in the upcoming quarters. By understanding these insights, we aim to build on our strengths, address our weaknesses, and position ourselves for stronger outcomes moving forward.

Heart Disease Classification


In this project, our goal is to analyze the causes of heart attacks and develop a predictive model for heart disease. We will use the Heart Disease Data Set from the UCI Machine Learning Repository, which includes patient data collected from Cleveland, Hungary, Switzerland, and Long Beach.

We will use Logistic Regression, k-Nearest Neighbors (kNN), Decision Tree, and Naive Bayes to build predictive models. Afterward, we will compare their performance to determine which model is the most effective. You can find the code here

Restaurant’s Visitor Forecast


In this project, the client wants us to forecast the number of visitors to their restaurant for the next 7 days using historical attendance data. We will employ multiple time series models, including ARIMA, ETS, and SNaive. After comparing the models, we will use the best one to provide ou final insights.

AdventureWork’s Sales Dashboard


In today’s competitive business environment, understanding sales data is crucial for driving growth and making informed decisions. Sales data analysis provides valuable insights into customer behavior, product performance, and market trends, enabling businesses to optimize their strategies and improve overall profitability.

This project aims to delve into a comprehensive analysis of sales data to identify key patterns and trends. We will explore various aspects such as sales volume, revenue, customer demographics, and seasonal fluctuations. By leveraging advanced analytical techniques and visualization tools (Power BI), we will uncover actionable insights that can guide decision-making processes and enhance sales performance.

House Price Prediction with Multiple Regression


In this project, we’ll take you through the process of using machine learning to predict housing prices. We’ll start with the basics and work our way to a practical example, delving into the intricacies of regression models. Our focus will be on building models to forecast house prices using data that includes features like facilities, materials, floors, and prices.

We’ll use a Linear Regression model due to its simplicity, ease of interpretation, and effectiveness for this type of predictive analysis.. You can find the code here

U.S Drone Strikes


With the rise of drone usage in counterterrorism, debates surrounding their operation have also intensified. When it was revealed that the U.S. used drones for targeted killings outside of official warzones, the body of literature on drone campaigns rapidly expanded. Due to the immediate-action nature of drone operations, this has led to less restrained acts of warfare. Questions about legality, accountability, and, most importantly, transparency have become central to the discourse on drone usage.

In this Data Analysis Project, I aim to showcase the level of transparency we have and highlight the discrepancies within it while also showcase my skills on using shinyapps as a tools of data visualization. You can find the code here

BoardGameGeek Statistics


BoardGameGeek is a testament to how the board game community continues to thrive in the digital age. It’s a place where you can seek game recommendations, clarify rules, and discuss strategies, among other things. Additionally, the site boasts the largest board game collection in existence, with over 100,000 tabletop and board games cataloged. Users can rate games, which impacts their overall rankings.

Given the wealth of information available on the site, I’m interested in analyzing and visualizing the website’s data to present it in a more engaging and accessible way to understand the history and popularity of Board Games along with its types. You can find the code here

Titanic: Passengers Survivability Factor


On April 15, after five days of sailing, the Titanic sank in the North Atlantic after hitting an iceberg. Out of the 2,222 passengers and crew on board, more than 1,500 lost their lives in the disaster. This tragic event has led to extensive studies and speculation about the inadequate emergency procedures that contributed to the tragedy, including issues like the shortage of lifeboats, breaches of maritime etiquette, and first-class prioritization, among others.

In this analysis project, we will explore and analyze some of these speculations related to the 1912 disaster. You can find the code here